Help
The Home page
[top]1 |
Side effect browser: the user can browse a maximum of three side effects either by name or UMLS ID. Side effects are organized by MedDRA's System and Organ Classes. In case more than one effect is selected, the resulting network only includes associated features common to all of them. |
2 |
Drug browser: select a drug which causes the side effect(s). When a drug is selected, only features associated with that drug are shown. |
3 |
Navigation through the biological and chemical space: IntSide data are based on the analysis performed by Duran-Frigola & Aloy, Chem. Biol., 2013, which consists of an enrichment analysis of drug features categorized in eight levels: Targets: Human targets with known pharmacological action from DrugBank. Proteins: Targets and off-targets from STITCH. Pathways: Biological human pathways from KEGG. Processes: Biological processes from Gene Ontology. Functions: Molecular function from Gene Ontology. Fragments: FP4 fingerprints provided by Open Babel. 307 SMARTS patterns encode molecular structures. Scaffolds: Scaffold network obteined through Murcko fragmentation of the full set of drug structures. Bemis & Murcko, J. Med. Chem., 1996 Structural terms: Chemical entities from ChEBI. For each side effect-feature pair, we computed a Fisher's exact test. We defined as 'associated' those drug features with a corrected Bonferroni p-value lower than 0.05. |
The Network page
[top]Protein networks
1 |
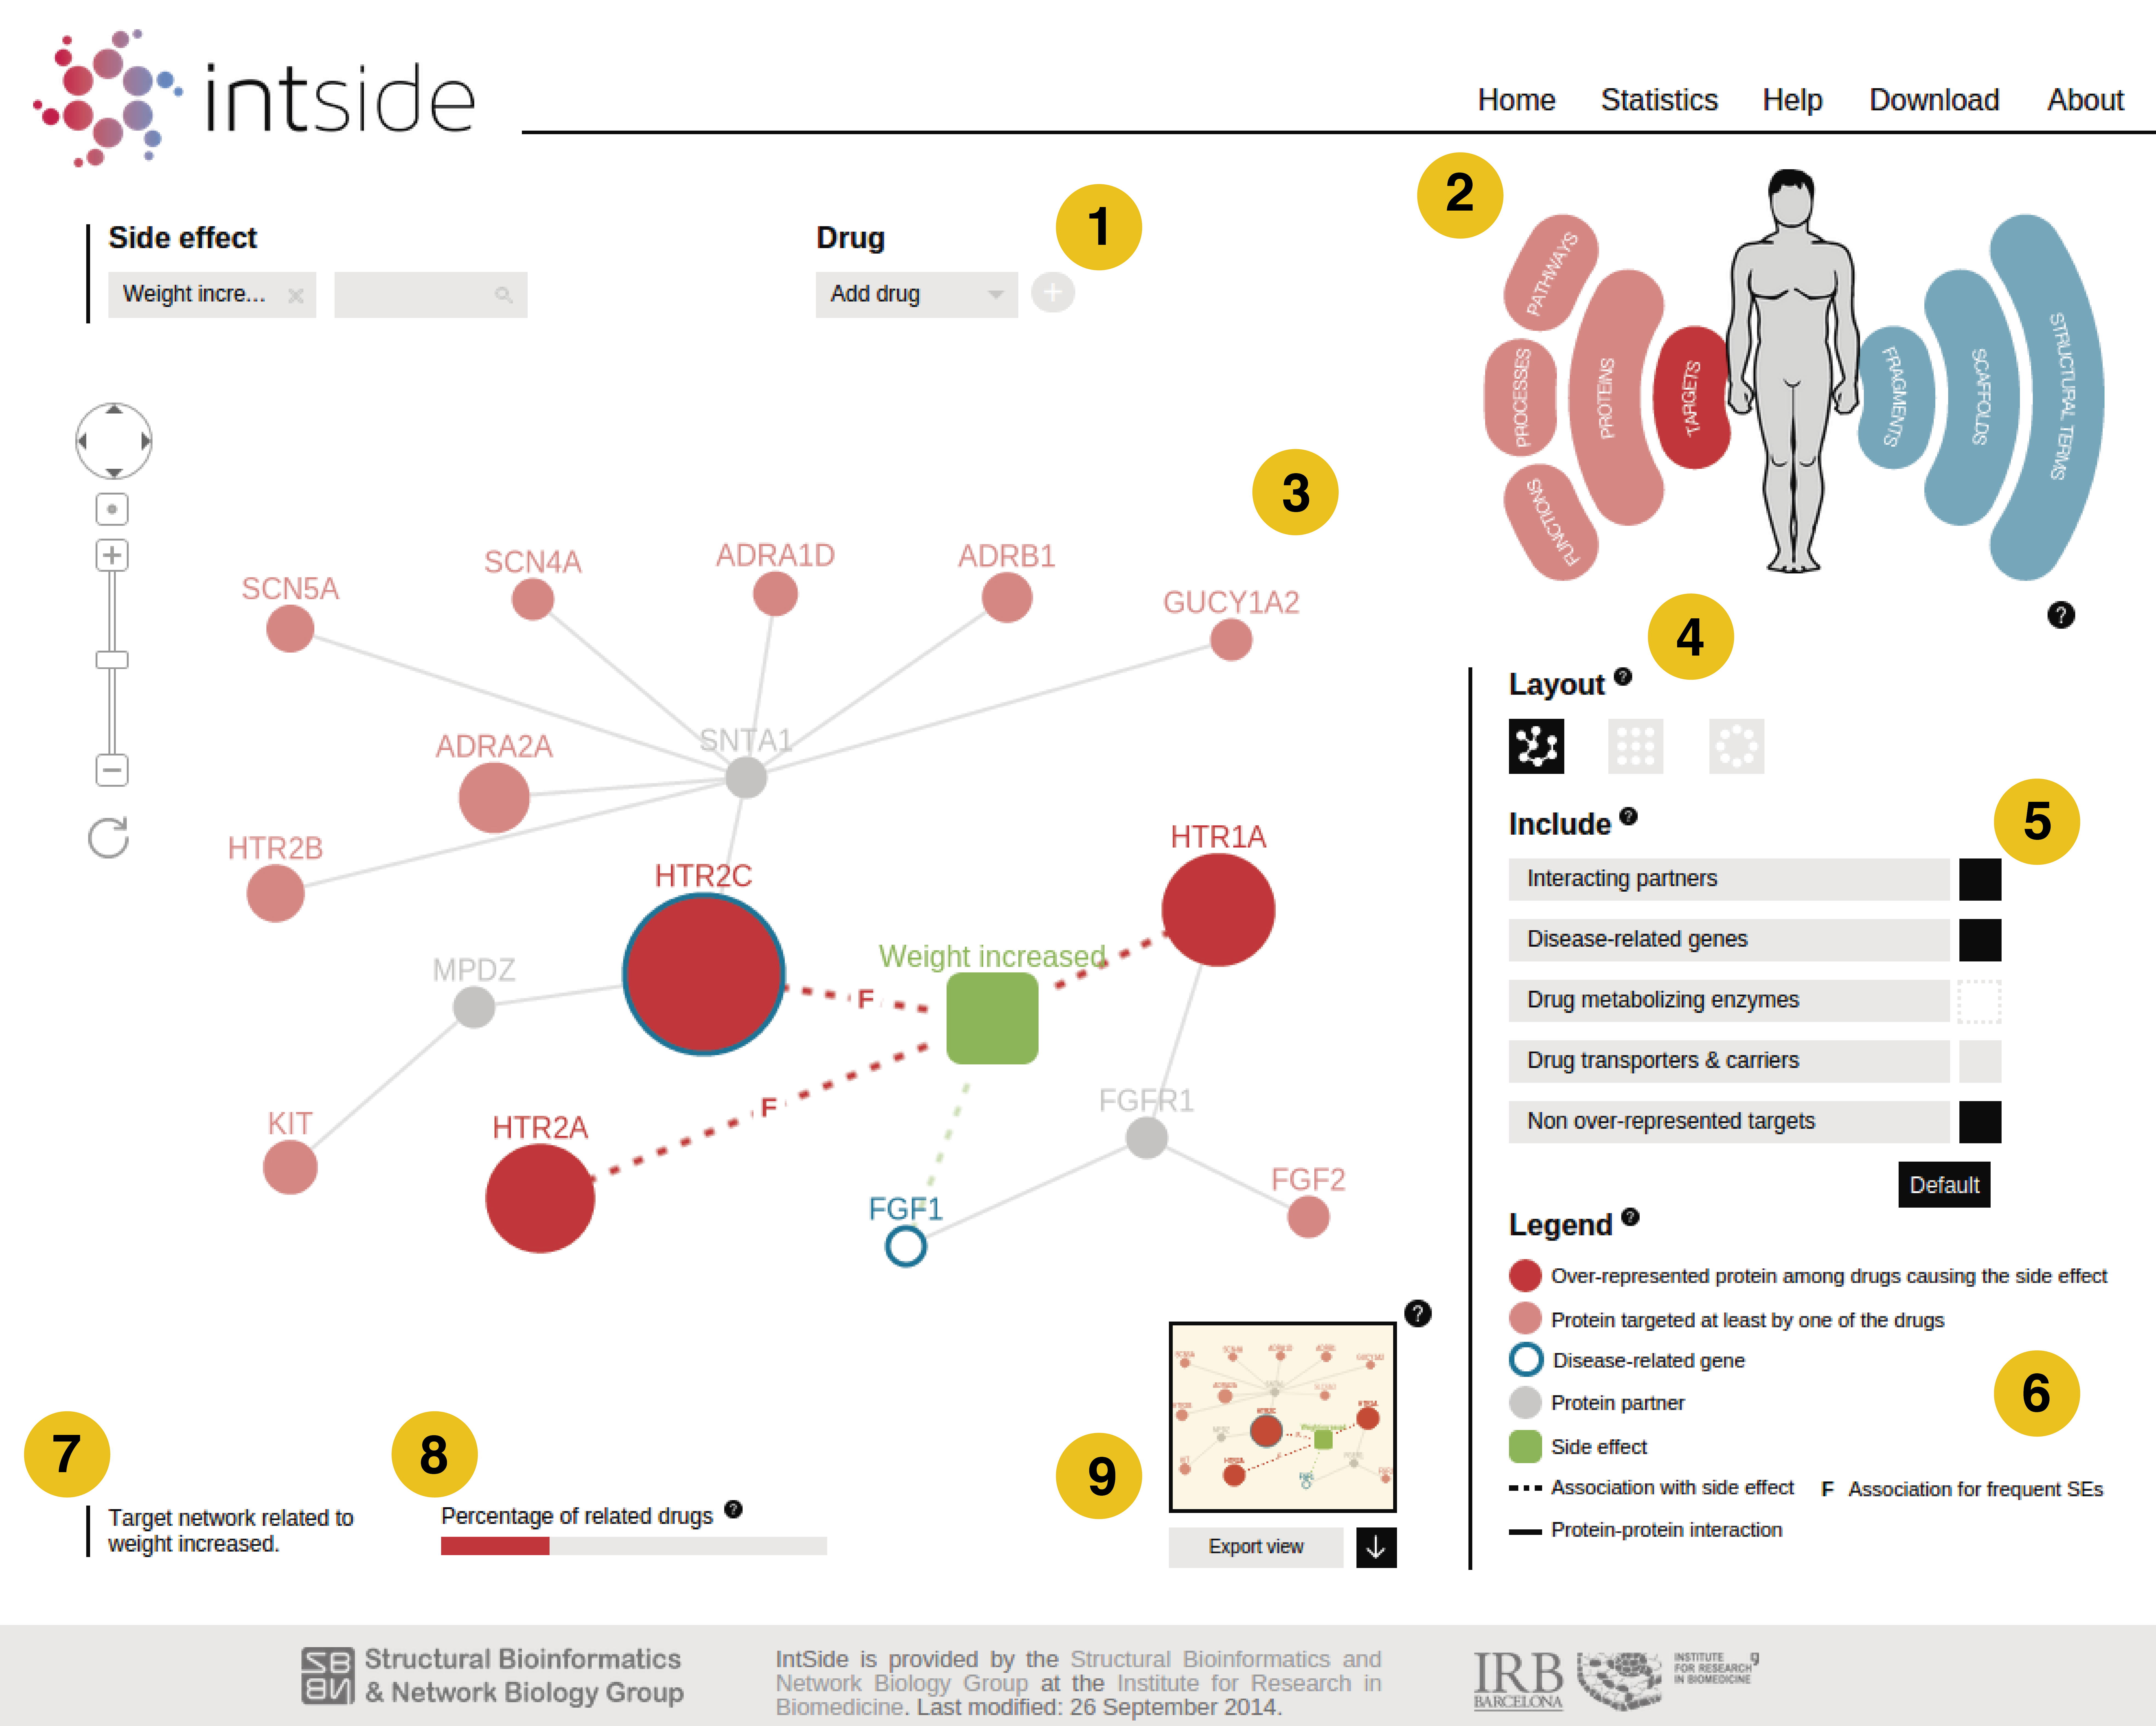
Side effect and drug browsers: The user can add side effects or can specify drugs to the current network. |
2 |
Navigation panel: Click on a category to explore other networks related to the side effect(s). |
3 |
Network view: Interactive visualization of the network.
A node can be dragged and dropped. |
4 |
Layout: Modify the arrangement of the nodes in the network. |
5 |
Include:
Default: click to load removed nodes and edges. |
6 |
Legend: Colors and symbols used in the network view. |
7 |
Title: The title summarizes the contents of the displayed network. |
8 |
Percentage of related drugs: This bar indicates the proportion of drugs causing the side effect and represented in the graph divided by the total number of drugs associated to the effect(s). It presents a sensitivity measure of the network displayed. |
9 |
Export current view: Download network information in TSV, XML, JSON or PNG format.
- XML format description: <graph> ROOT <node id = "nodeID"> NODE label <att name="class"> Node class (over-represented protein/feature, gene, side effect, drug...) </class> <att name="name"> Node name </name> Other attributes depending on the class of the node </node> <edge source = "node1 ID" target = "node2 ID"> EDGE label <att name="interaction"> Type of interaction (ppi, over-represented feature...) </interaction> <att name="pvalue"> Bonferroni p-value </pvalue> </edge> </graph>
- TSV format description: network information is presented as
an interaction per row. Node attributes (ID, name, symbol,
pvalue, class and size) are given in the columns. |
FAQs
[top]How do I cite IntSide?
To cite IntSide in your publications:
Juan-Blanco, T., Duran-Frigola, M., & Aloy, P. (2014)
IntSide:
a web server for the chemical and biological examination of drug
side effects.
Bioinformatics; doi:
10.1093/bioinformatics/btu688
When is the database updated?
IntSide is updated every six months. Last updated: April 2014.
What is an over-represented or associated feature?
A feature is associated with a side effect if it is over-represented among drugs causing it in comparison with the full drug set. For each side effect feature pair, we computed a Fisher's exact test and took as associated those with a corrected Bonferroni p-value < 0.05. For further information, please see Duran-Frigola & Aloy, Chem. Biol., 2013.
What does the size of the nodes mean?
Node size correlates with the number of side effects to which the node is associated.
What is the meaning of the red/blue bar (percentage of related drugs) below the network?
It indicates the number of side effect-related drugs that are represented with features in the network over the total number of side effect-related drugs
What are the drugs displayed when I click a node?
They are drugs causing the side effects in the network and that are represented with a feature by the nodes.


